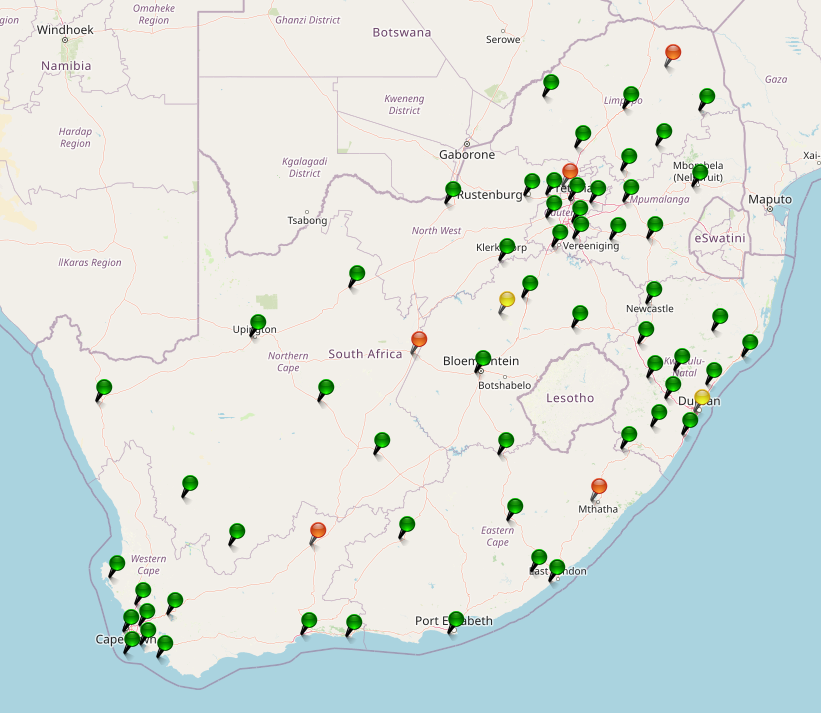
The South African GNSS network (TrigNet, website) counts 64 stations distributed all over the country, with inter-station distances ranging from 80 km to 300 km. The network provides users with data for both real-time and post-processing applications. An example of real-time service is the provision of RTK corrections to augment the positioning precision of the user equipment. The GNSS raw data that can be downloaded for post-processing applications can also be used to estimate the tropospheric Zenith Total Delay (ZTD), that is the delay of GNSS signals due to their passage through the lower layers of the atmosphere. As explained in previous TWIGA blogs, the ZTD is a useful parameter for meteorological applications, as most of it is related to the amount of water vapor in the atmosphere. Atmospheric water vapor is a key ingredient in the genesis of rain events, particularly those of convective nature that can generate rainstorms.
Distribution of TrigNet GNSS stations
Alternative techniques to monitor parameters that can be directly related to the amount of atmospheric water vapor include the radiosondes (i.e. “weather balloons”), that are typically launched twice a day in most countries. While having different measurement rates (12 hours for radiosondes, versus few minutes or even a few seconds for GNSS), and despite the GNSS limitation of not being able to distinguish vertical variations of water vapor, the two measurement techniques can be compared in terms of ZTD.
To support a TWIGA experiment conducted by Politecnico di Milano, about data assimilation into a numerical weather prediction model of GNSS- and SAR-derived tropospheric delays, GReD estimated the ZTD for all the TrigNet stations over a timespan of about two months, using the Breva software (developed by GReD). The resulting ZTD was compared to that of two radiosondes launched from Upington and Pretoria. The plots below show the comparison, demonstrating an agreement below 1 cm for Upington and 2 cm for Pretoria (the higher error, in this case, could be because the GNSS station is 21 km away from the radiosonde launch site). These values correspond respectively to a difference in terms of precipitable water vapor ranging from about 1 to 3 mm, which is expected when comparing these two measurement techniques.


RELATED TWIGA SERVICE: GNSS FOR ATMOSPHERIC PRESSURE
Written by: Eugenio Realini (GReD) and Alessandra Mascitelli (UniPD)